
USDA-NIFA Extension IPM Grant
Pest & Crop Newsletter, Entomology Extension, Purdue University
Soybean Aphid Activity Picking Up - (Christian Krupke and John Obermeyer)
• Numbers vary considerably from field to field.
• Cooler temperatures favoring aphid development.
• Treatment threshold and application guidelines given below.
Because of the tremendous variability in aphid numbers from field to field, diligent scouting NOW can pay big dividends. The following is a quick scouting review.
Sampling: Count aphids, primarily on the undersides of leaves, on at least 20 plants (the more, the better) in various areas of the field. When aphids are just beginning to colonize soybean plants, they will be concentrated on the most active growing points – the newest unrolled leaves and the developing pods.
Aphid Number: Should you find an average of 250 or more aphids/plant during the early soybean reproductive stages (R1-R4), a treatment is justified. Refer to the following treatment guide. The established threshold of ≥ 250 aphids/plant includes a buffer time of about a week to get the field sprayed. In other words, damage is not occurring at 250 aphids/plant. During the seed-fill stages (R5-R6), treatment is not as clear-cut. If aphid numbers are increasing and plants are under stress a treatment is justified. This usually occurs when dry soil conditions are prevalent. Do NOT treat soybean beyond the R6 stage of growth – there is no advantage in terms yield preservation!
Weather: The temperatures (upper 70’s to low 80’s) we are experiencing are optimal for aphid development and reproduction. Rainfall, including some hard downpours, will have some negative effect on aphid populations, but does not wipe them out.
Predators: Most pest managers calling to report aphid numbers are also aware of predator populations (mostly Asian lady beetles). We appreciate their desire to preserve natural enemies and prevent unwarranted pesticide treatments. However, once aphid levels reach over 100 per plant, predators may not be able to keep ahead of the aphid’s reproductive capability.
Treatment: Should control be necessary, complete coverage on the foliage seems to be the key. Ground driven rigs applying at least 20 gallons per acre with 40 PSI with fine droplets will help penetrate the canopy. Finer droplets are desirable when spraying any insecticide on soybeans, and ground application is usually a better approach for canopy penetration. Aerial application success is dependent on finished spray volume (we recommend 5 gallon/acre) and air movement into the canopy.
Products labeled for soybean aphid control can be viewed by clicking HERE <http://extension.entm.purdue.edu/publications/E-77.pdf>
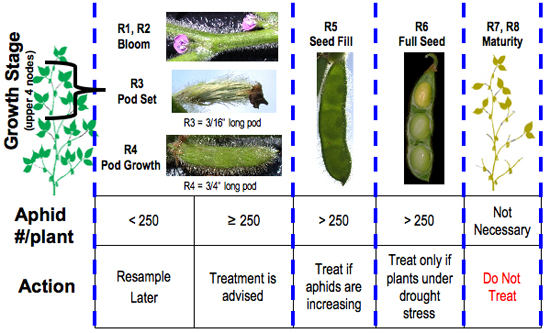
Soybean aphid treatment threshold guide.
![]()
![]()
Click here to see the Black Light Trap Catch Report
![]()
Western Bean Cutworm Adult Pheromone Trap Report
![]()
When Will My Corn Crop Mature? – (Bob Nielsen) -
• Simplest way to estimate? Add 62 days to the date your crop was pollinating.
• More complicated, but not necessarily more accurate? Base estimate on GDDs from silking to black layer.
Planting of Indiana’s corn crop certainly got off to a late start, but finished strong once it did begin (Fig. 1). Nevertheless, half of the state’s crop was planted after mid-May (Fig. 1) which positions the 2013 planting season among the latest in recent years (Fig. 2). The lateness of the crop planting was accentuated by our collective short-term memories of the extreme early pace of corn planting in 2012 (Fig. 2).
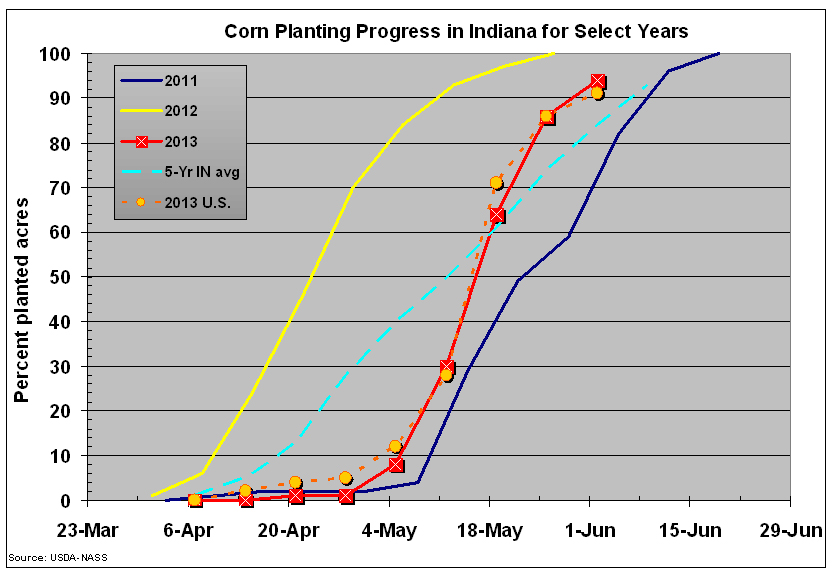
Figure 1. Statewide planting progress in Indiana, select years.
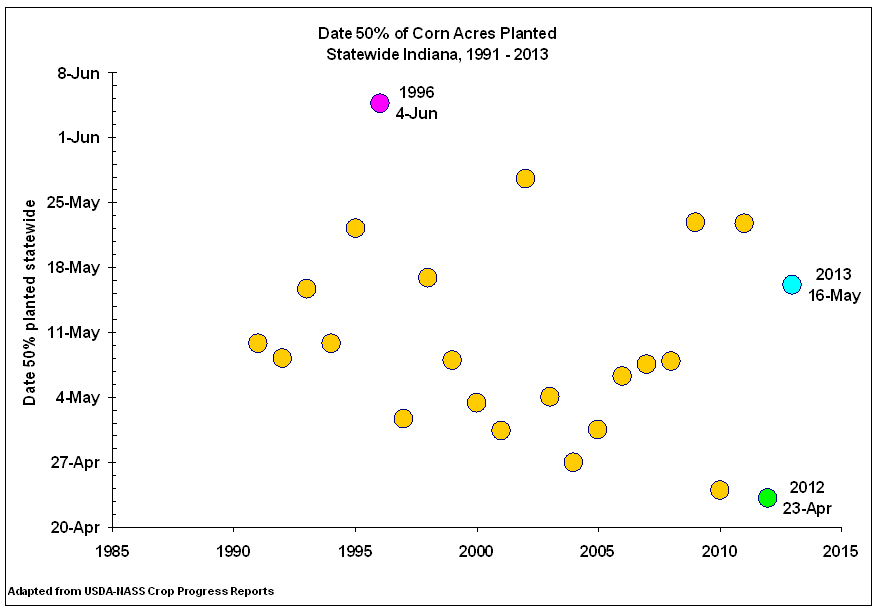
Figure 2. Historical perspective of dates by which half of Indiana's corn crop was planted, 1991-2013.
As most everyone is aware, the calendar pace of corn development is strongly driven by temperature. The warmer it is, the faster the calendar pace of development and vice versa. The conceptual measure of the accumulation of “heat” is defined by the calculation of Growing Degree Days, abbreviated as GDDs (Nielsen, 2012).
From May 1 through the end of July, statewide accumulation of GDDs in Indiana ranged from slightly below normal in the southwest to slightly above normal in the northwest (Fig. 3). On the one hand, it would have been nice if GDD accumulation had been quite a bit above normal because that would have helped later-planted crops “catch up” calendar-wise. On the other hand, we can be thankful that the season to date has not been significantly cooler than normal or else the late-planted crop would fallen further behind in development.
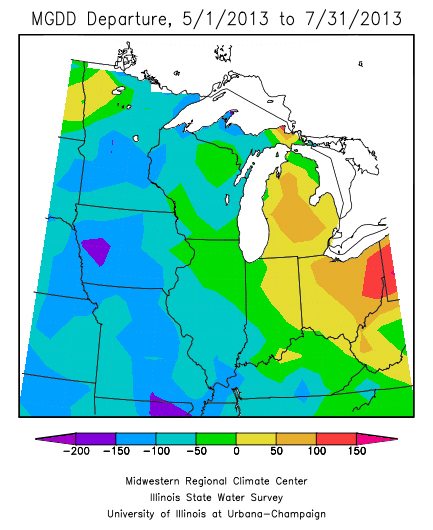
Figure 3. Departure from normal for GDD accumulation from 1 May 2013 through 31 July 2013 in the heart of the U.S. Corn Belt.
As it is, the majority of the state’s crop pollinated during the last two weeks of July (Fig. 4). Another way of looking at it is that half of the state’s crop had pollinated by 18 July (Fig. 5), which interestingly is equal to the average date for 50 percent of the crop silked from 1991 to 2013. From that perspective, the 2013 Indiana corn crop is not that far behind in silking.
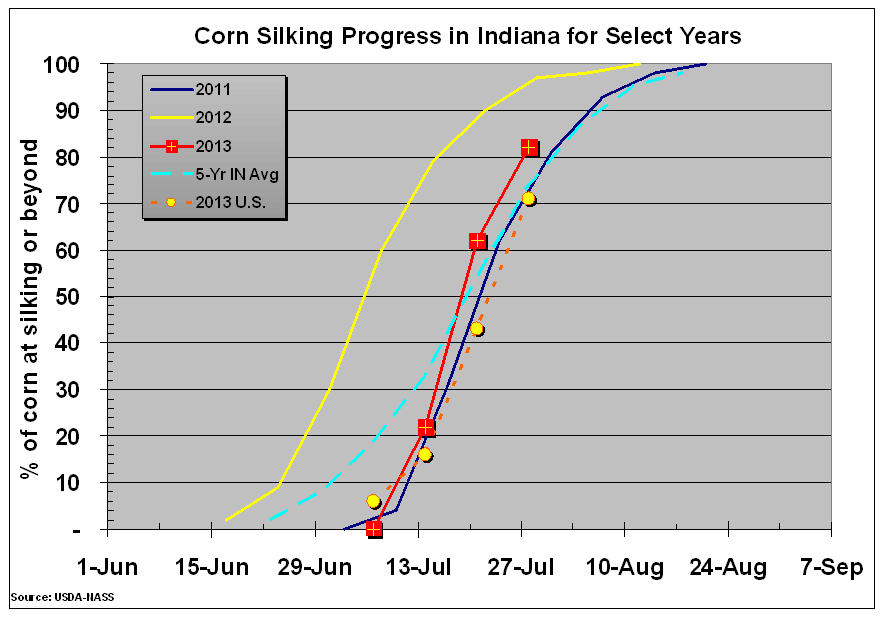
Figure 4. Percent of statewide corn crop at silking or beyond for select years, Indiana.
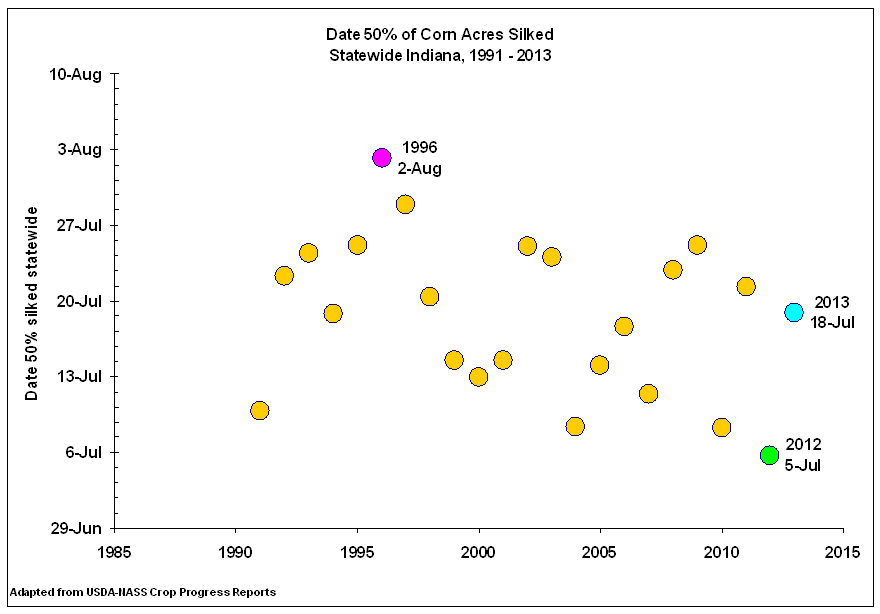
Figure 5. Historical perspective of dates by which half of Indianas corn crop had silked, 1991-2013.
Nevertheless, folks who planted their corn later than normal are now beginning to worry whether their crop will mature safely before a killing fall freeze. Their concern is heightened because the current weather forecast for the next two to four weeks calls for below normal temperatures throughout much of August (forecast as of 31 July by NWS Climate Prediction Center).
Remember that the phrase “mature safely” refers to the development of kernel black layer that signals the end of dry matter accumulation in the grain (Nielsen, 2008) and, thus, means that the crop is physiologically “safe” from the effects of fall frosts or freezes relative to impact on grain yield. Grain moisture content at physiological maturity typically ranges from 25 to 35 percent and so additional calendar time is required for dry down of the grain in the field before harvest.
There are two ways to estimate the dates by which a corn crop may reach physiological maturity.
The first way is a general rule of thumb based on average calendar times from silking to maturity using historical crop progress data from USDA-NASS (Fig. 6). Since 1991, the average number of days between the date by which 50 percent of the state’s crop reached silking to the date by which 50 percent of the state’s crop reached maturity is about 62. Interestingly, there is not much relationship between the the date that the crop silked and the number of days from silking to maturity.
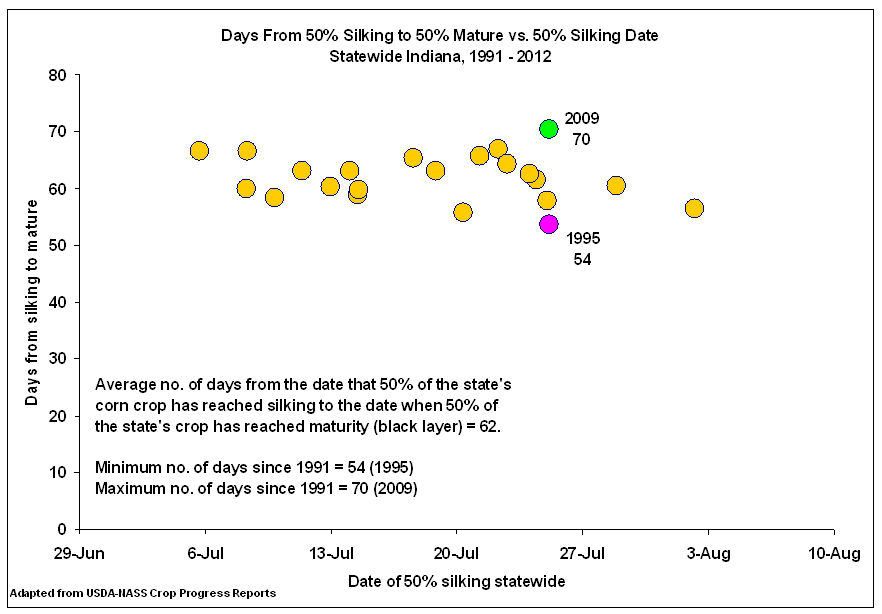
Figure 6. Historical perspective of the number of days from silking to maturity based on the dates by which 50% of the crop had silked or matured.
So, the rule of thumb is to add 62 days to the date(s) that your crop was pollinating and that will be the approximate date by which the crop(s) will reach kernel black layer (maturity). For example, let’s say your crop pollinated around July 25. Add 62 days to that and the estimated date the crop may reach maturity is Sept 25.
Clearly, this rule of thumb is influenced by temperatures during the grain filling period. Warmer than normal temperatures will shorten the grain filling period and hasten maturity, while cooler than normal temperatures will lengthen the grain filling period and delay maturity. This effect of temperature during grain fill is best illustrated with the 1995 and 2009 growing seasons (Fig. 6). In each year, 50 percent of the state’s corn crop had reached silking by 25 July. Yet, the 1995 crop (warm grain filling period) reached maturity in only 54 days after silking while the 2009 crop (cool grain filling) did not reach maturity until 70 days after silking.
The second way to estimate the dates by which a corn crop may mature is based on the anticipated GDD requirement from silking to kernel black layer. With this value in hand, knowledge of the silking date for the field, and access to historical weekly GDD normals (Nielsen, 2012), you can estimate the approximate week of the crop will mature........ assuming temperatures during grain filling are normal.
For example: A hybrid with a grain fill GDD rating of 1200 that silked the week of July 25 in northwest Indiana might be expected to reach kernel black layer towards the end of September or early October based on historical GDD accumulations after July 25. It is interesting to note that the estimate of crop maturity date using this method is very similar to that using the simpler rule of thumb based on 62 days between silking and maturity.
Few companies publish [silking to black layer] GDD values directly, but many publish hybrid GDDs from planting to silking and from planting to kernel black layer. Consequently, you can use the two values for a hybrid and calculate the GDDs from silking to black layer by substracting the silk GDDs from the black layer GDDs. For example, a hybrid rated as needing 1300 GDDs to silking and 2500 GDDs to black layer would therefore require 1200 GDDs from silking to black layer (2500 - 1300 = 1200).
Disclaimer, Disclaimer, Disclaimer
As I indicate throughout this article, growing conditions throughout the remainder of the grain filling period greatly influence the actual number of days between silking and kernel black layer for any given field of corn. Coupled with inherent differences among hybrids, you should implement these rules of thumb cautiously and use the calculated predictions of maturity dates as approximations.
Related Reading
Nielsen, R.L. (Bob). 2008. Grain Fill Stages in Corn. Corny News Network, Purdue Univ. [On-Line]. Available at <http://www.kingcorn.org/news/timeless/GrainFill.html> [URL accessed Aug 2013].
Nielsen, R.L. (Bob). 2012. Heat Unit Concepts Related to Corn Development. Corny News Network, Purdue Univ. [On-Line]. Available at <http://www.kingcorn.org/news/timeless/HeatUnits.html>. [URL accessed Aug 2013].
USDA-NASS. 2013. Crop Progress. USDA Nat’l Ag. Statistics Service [online] <http://usda.mannlib.cornell.edu/MannUsda/viewDocumentInfo.do?documentID=1048>. [URL accessed Aug 2013].
![]()
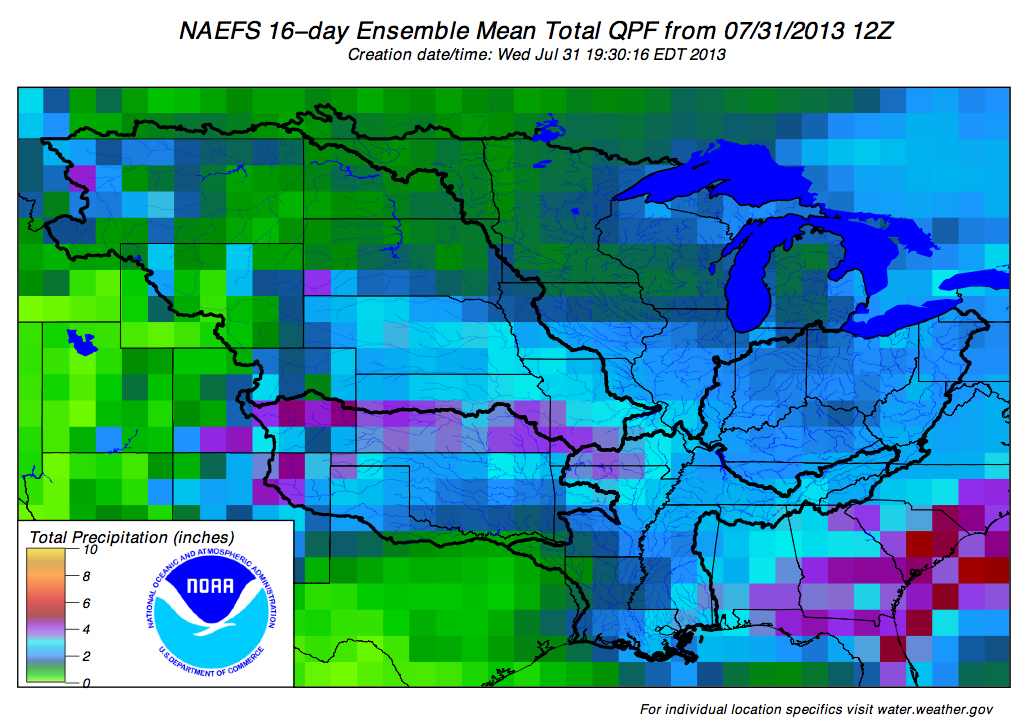
Weather Outlook by NWS OHRFC (James Noel, NOAA/NWS/Ohio River Forecast Center)
Fairly good growing conditions will continue across Indiana the into early August.
Temperatures and rainfall will be slightly below normal through August 3.
From August 4-15, more summer-like weather will build in with a return of a tropical air-mass. This will allow temperatures to return to normal or above normal and rainfall to normal or above normal.
The latest 2 week rainfall map is located here: <http://www.erh.noaa.gov/ohrfc/HAS/images/NAEFS16day.pdf>.
Right now, August is shaping up to be about normal from all the latest indications.
![]()
![]()
![]()