
USDA-NIFA Extension IPM Grant
Pest & Crop Newsletter, Entomology Extension, Purdue University
Managing Rotten Corn: An Overview of Corn Ear Rots – (Kiersten Wise) -
Weather conditions are favorable for several different ear rots of corn in Indiana this year. As harvest begins, it is important to identify fields that may have ear rots to ensure timely harvest and proper storage of moldy grain. Several economically important ear rots impact Indiana, including Diplodia ear rot, Gibberella ear rot, Fusarium ear rot, and Aspergillus ear rot. A different fungus causes each of these rots, and the environmental conditions at and just after silking influence which ear rot may be problematic in a given year. Additionally, some of these fungi are able to produce mycotoxins as a byproduct of the infection process. Mycotoxins can be toxic to humans and livestock, and are carefully regulated in food and feed. Proper identification of ear rots is key for managing affected grain.
Aspergillus Ear Rot
Aspergillus ear rot is caused by the fungus Aspergillus flavus, and is one of the most concerning ear rots due to its associated mycotoxin, aflatoxin. This fungus infects during hot, dry weather after pollination occurs, and was particularly problematic in 2012. Drought stressed areas are most affected by the disease. Aspergillus ear rot is typically identified by an olive green, dusty mold that is often at the tip of the ear, but can be scattered on kernels throughout the ear (Figure 1). Symptoms usually appear first in fields with dry soils or other issues, such as nutrient deficiencies, or insect damage. The mycotoxin aflatoxin is a potent carcinogen, and is regulated in feed and silage. Table 1 specifies the U.S. Food and Drug Administration (FDA) action thresholds for various end uses of grain. Aflatoxins are of concern to dairy producers in particular because the FDA regulations require aflatoxin residues in milk to be less than 0.5 ppb. To prevent the carry over of aflatoxins into milk, silage and other feed components should not contain greater than 20 parts per billion (ppb) aflatoxin.
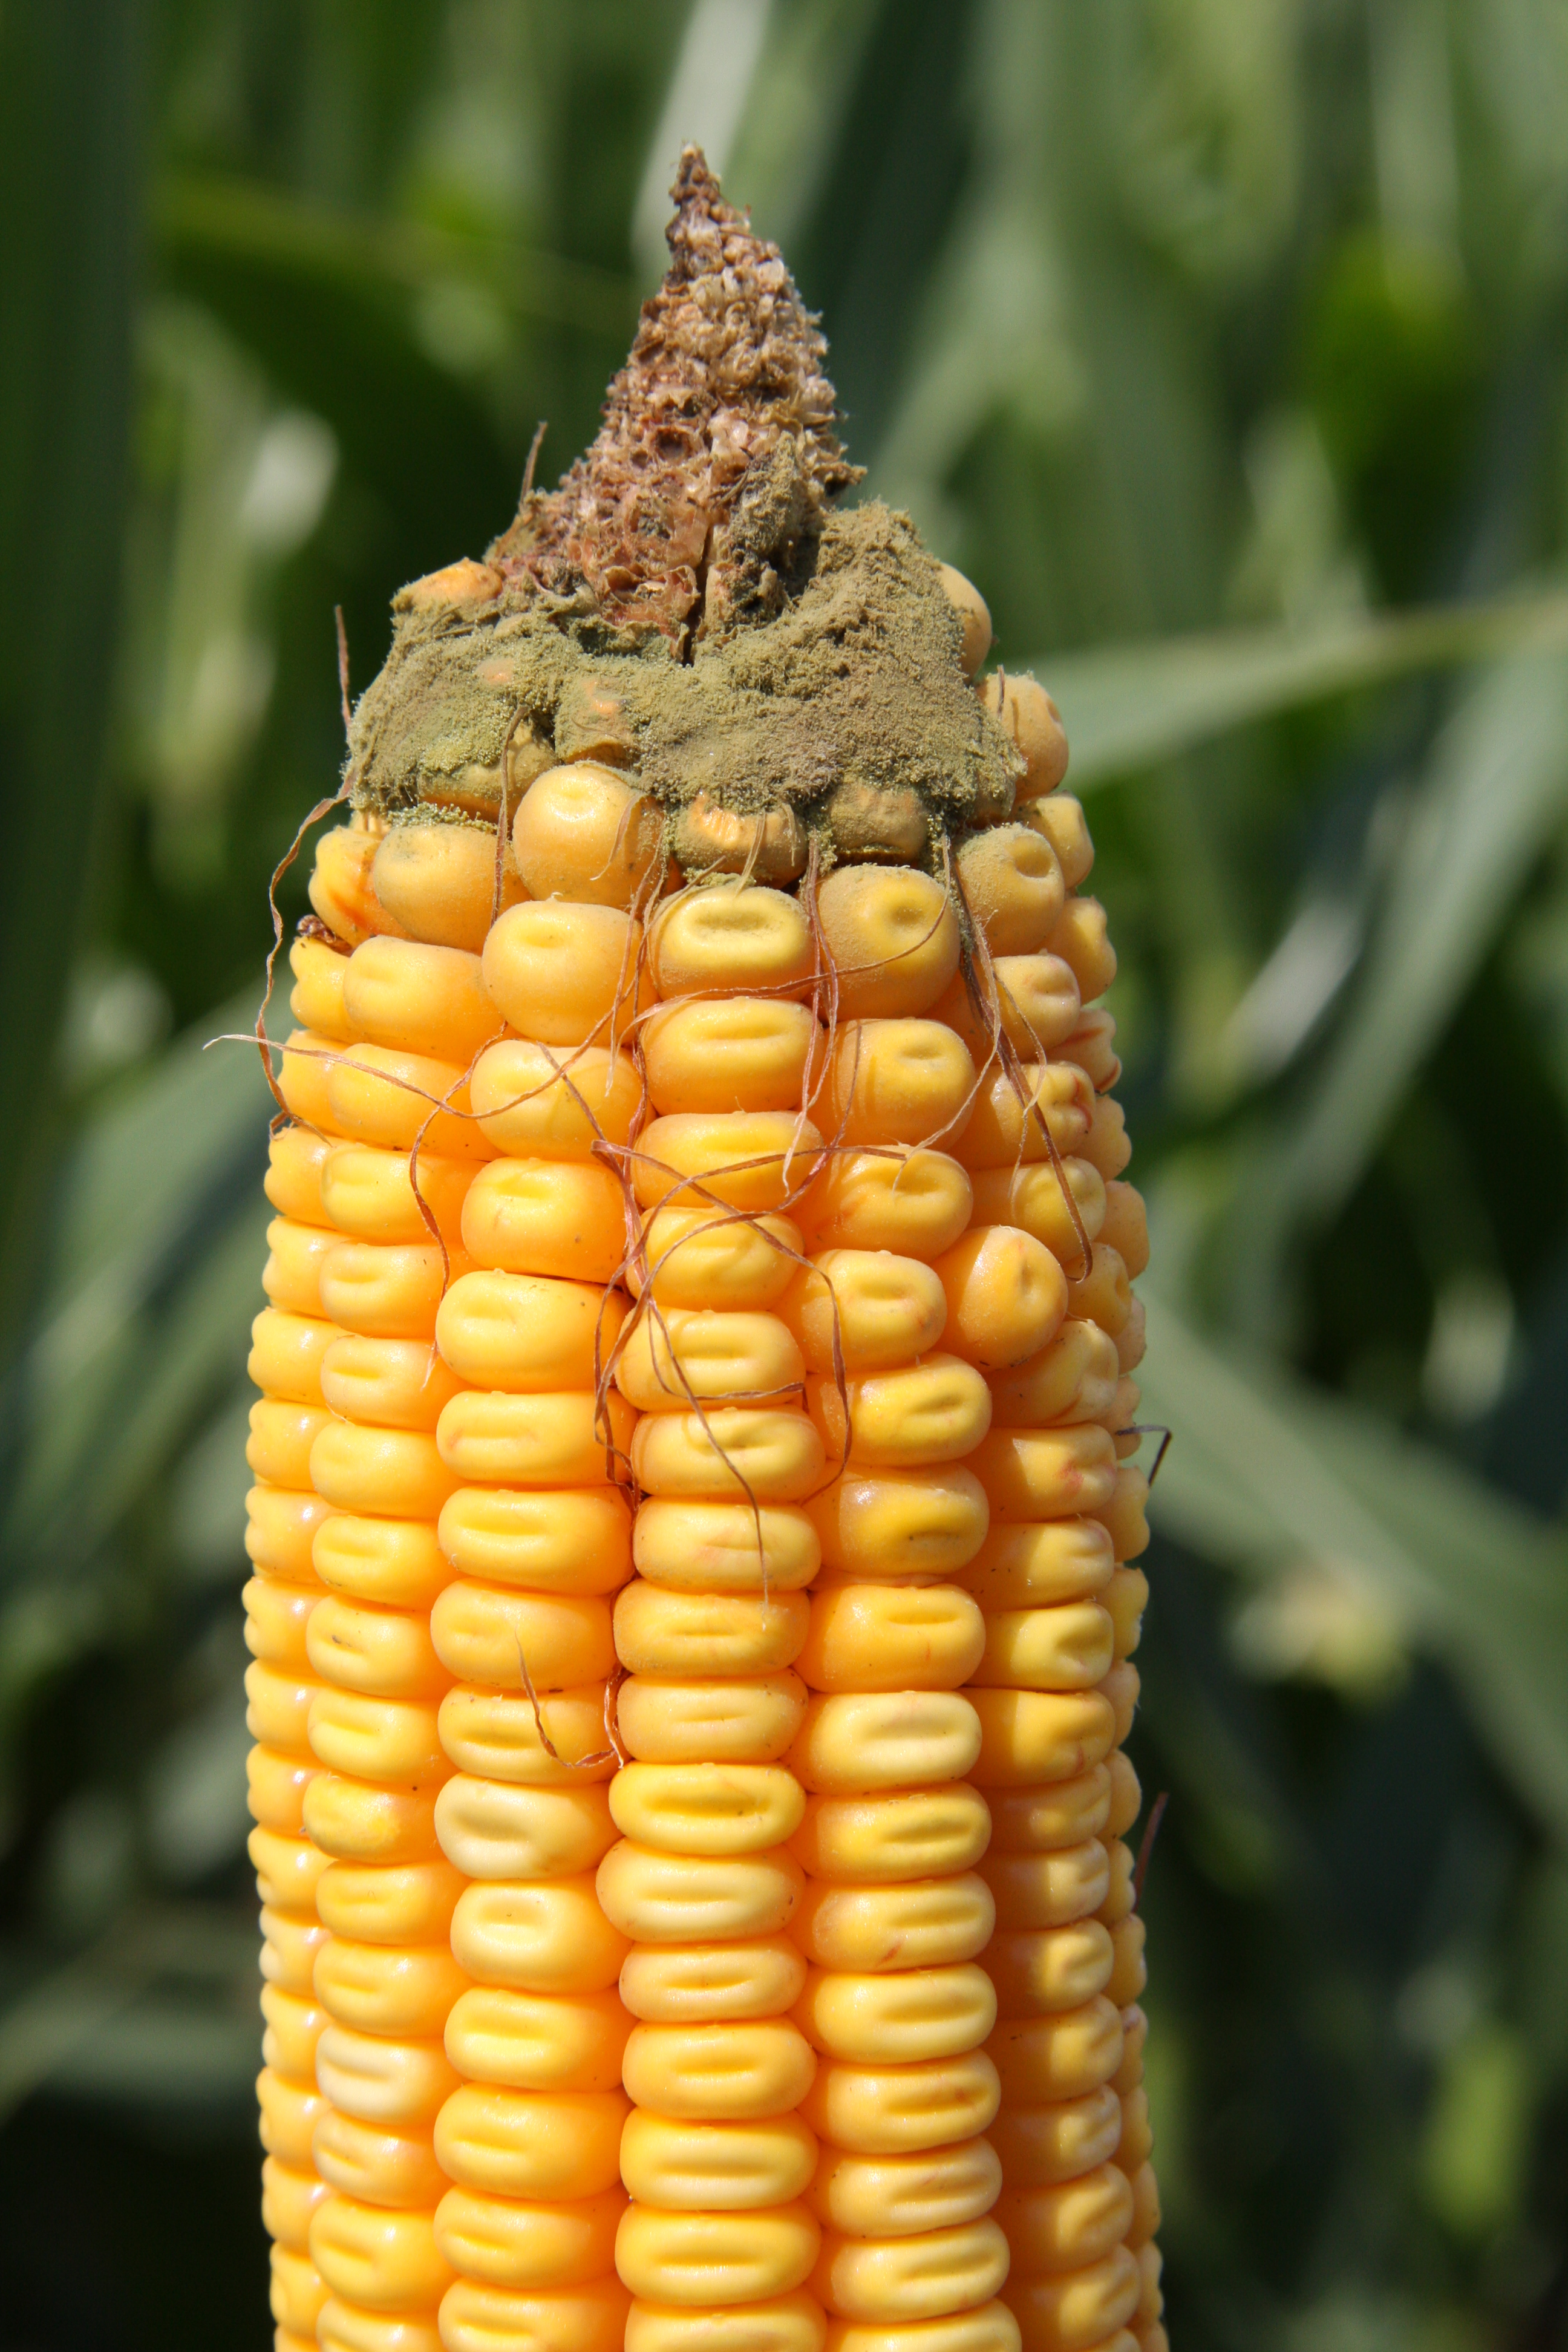
Figure 1. Olive-green dusty mold on ear is indicative of Aspergillus ear rot.
(Photo Credit: Corey Gerber).
| Table 1. U.S. FDA action levels for aflatoxin contaminated corn. Source: FDA Regulatory Guidance for Toxins and Contaminants. <http://www.ngfa.org/wp-content/uploads/NGFAComplianceGuide-FDARegulatoryGuidanceforMycotoxins8-2011.pdf> | |
| Aflatoxin Action Level (Parts Per Billion) | End Use of Grain |
| 20 | Corn for animal feed and feed ingredients for dairy animals |
| 20 | Corn for human consumption |
| 100 | Corn grain for breeding cattle, swine and mature poultry |
| 200 | Corn grain intended for fishing swine of 100 lbs. or greater |
| 300 | Corn grain intended for finishing beef cattle |
Diplodia Ear Rot
Diplodia ear rot is caused by the fungus Stenocarpella maydis, and is very common in cornfields across the Corn Belt. This fungus survives in residue and infects plants approximately two weeks after pollination. Humid weather and rains prior to and after pollination will favor disease development. Diplodia ear rot is identified by white fungal growth on the cob, often forming a mat of fungus across the ear (Figure 2). Infected kernels may also be brown-gray in appearance. Small, black fungal structures called pycnidia may form on the kernels or the cob. The fungus is reported to produce a mycotoxin called diplodiatoxin in South America and South Africa, however, no reports of toxic effects of grain on livestock or humans due to Diplodia ear rot have been reported in the United States. Grain dockage may still occur, however, due to moldy grain.
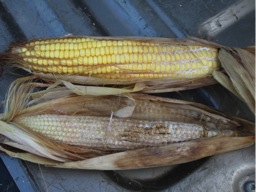
Figure 2. The fungus that causes Diplodia ear rot produces a white fungal mat on the cob.
(Photo Credit: Corey Gerber).
Fusarium Ear Rot
Fusarium ear rot is primarily caused by the fungus Fusarium verticilliodes. This fungus infects corn after pollination, and often overlaps with Aspergillus ear rot since infection is favored by warmer temperatures. Fusarium-infected ears may have white fungal growth on the cob, or symptoms may appear as discolored kernels scattered throughout a cob or associated with insect feeding. Visible fungal growth may not be obvious on the cob, but a white “starburst” pattern in kernels can sometimes be observed on ears infected by this fungus (Figure 3). The mycotoxin fumonisin is associated with Fusarium ear rot.
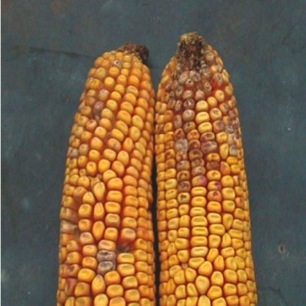
Figure 3. Grey-brown kernels resulting from the fungus that causes Fusarium ear rot
(Photo Credit: Charles Woloshuk).
| Table 2. U.S. FDA action levels for aflatoxin contaminated corn. Source: FDA Regulatory Guidance for Toxins and Contaminants. <http://www.ngfa.org/wp-content/uploads/NGFAComplianceGuide-FDARegulatoryGuidanceforMycotoxins8-2011.pdf> | |
| Animal | Maximum Fumonisin Levels Allowed in Grain or Grain By-products |
| Equids and Rabbits | 5 ppm (not to exceed 20 percent of ration with finished feed = 1 ppm) |
| Swine and Catfish | 20 ppm (not to exceed 50 percent of diet with finished feed = 10 ppm) |
| Breeding ruminants, breeding poultry | 30 ppm (not to exceed 50 percent of diet with finished feed = 15 ppm) |
| Ruminants 3 months or older being raised for slaughter | 60 ppm (not to exceed 50 percent of diet with finished feed = 30 ppm) |
| Poultry being raised for slaughter | 100 ppm (not to exceed 50 percent of diet with finished feed = 50 ppm) |
| All other species or classes of livestock and pet animals | 10 ppm (not to exceed 50 percent of diet with finished feed = 5 ppm) |
Gibberella Ear Rot
Gibberella ear rot, caused by the fungus Gibberella zeae, is common during cool, rainy years. The fungus infects during early silking and pollination, and is favored by cooler temperatures than the previously described ear rots. This fungus produces a fungal mat on the ear, similar to Diplodia ear rot, but often with a pink or reddish color to the mold (Figure 4). Gibberella zeae produces the mycotoxin deoxynivalenol (DON), commonly referred to as vomitoxin. This mycotoxin can be extremely harmful to swine, and is carefully regulated according to the FDA action levels defined in Table 3.
Figure 4. A pink mold on the ear is a sign of the fungus that causes Gibberella ear rot
(Photo Credit: Charles Woloshuk).
| Table 3. U.S. FDA action levels for aflatoxin contaminated corn. Source: FDA Regulatory Guidance for Toxins and Contaminants. <http://www.ngfa.org/wp-content/uploads/NGFAComplianceGuide-FDARegulatoryGuidanceforMycotoxins8-2011.pdf> | |
| Animal | Maximum DON Level Allowed |
| Swine | 5 ppm (not to exceed 20 percent of ration with finished feed = 1 ppm) |
| Ruminating beef and feedlot cattle more than 4 months old | 10 ppm (not to exceed 50 percent of diet with finished feed = 5 ppm) |
| Poultry | 10 ppm (not to exceed 50 percent of diet with finished feed = 5 ppm) |
| All other animals | 5 ppm (not to exceed 40 percent of diet) |
Mycotoxins
Mycotoxins are a by-product of fungal infection, and are not living organisms themselves. Often farmers or crop advisors incorrectly believe that they can kill or remove mycotoxins from grain, which is not the case. Mycotoxins are extremely stable in grain and plants, and heat, freezing, and chemicals will not degrade these compounds. Mycotoxins are at higher levels in fines and foreign material in grain and it is possible to screen or clean grain to remove these smaller particles containing mycotoxins. Coring bins can also help reduce mycotoxins if affected grain accumulates in this area. None of these practices remove mycotoxins directly from grain, but remove grain affected by mycotoxins.
Testing for mycotoxins
Sample collection and preparation are extremely important to get an accurate test for mycotoxins in silage or grain. A sample submitted for analysis should be made up of several samples combined and taken from different areas within the silage mass or grain. Sampling several different times from a moving stream of grain while the grain is loaded or unloaded is the preferred method for sample collection. The USDA Grain Inspection Handbook has specific recommendations and methods for sampling to ensure that the sample to be tested represents the grain population accurately. This handbook can be found at <http://www.gipsa.usda.gov/GIPSA/>.
Mycotoxin production in silage represents a particular challenge. Mycotoxins will occur in the area of silage exposed to air, so samples from moldy silage should also be submitted for analysis. If sampling moldy silage for analysis, it is important to take a separate sample from an area that is not moldy and submit that also. Care should be taken with handling samples to assure that mycotoxins do not accumulate in the sample during shipping. Drying the sample below 15% moisture will slow fungal growth and mycotoxin production. Freezing the sample and shipping on ice by a one-day delivery service is another option. It is important to test silage for mycotoxins, such as aflatoxin, since chemicals such as nitrates can cause similar animal symptoms to those caused by mycotoxins.
Mycotoxins can be assessed by using several different chemical and immunocapture technologies, but analyzing mycotoxins can be a challenge due their complex nature. It is important to not rely solely on visual methods, such as the blacklight test, for confirmation of mycotoxins. Visual test results can be inconsistent, and therefore samples should be sent to professional laboratories for analysis.
Ear Rot Management
Preventative management of ear rots is critical, and can be accomplished by selecting less susceptible hybrids and reducing the amount of corn residue that can serve as a source for the fungus to overwinter. This is accomplished through crop rotation and tillage. In-season management of ear rots is limited at this point, with few fungicides and anti-fungal products available for specific ear rots. Efficacy data for these fungicides are limited.
If conditions in-season are favorable for ear rot development, farmers should scout fields prior to harvest and determine the level of incidence of any ear rot in the field. If ear rots are observed in a field, affected areas should be harvested early and grain segregated to avoid mycotoxin contamination of non-infected grain. Silage and grain harvested with suspected ear rots should be dried to below 15% moisture. If grain or silage (with kernels present) is kept above this moisture content, mycotoxin can continue to accumulate in grain. All grain contaminated by any ear rot fungus should be stored separately from good grain, and if stored long term, stored below 13% moisture to prevent further growth of fungi.
References
Excerpts from this article from: Kuldau, G.A., and Woloshuk, C.P. Screening for Mycotoxins in Silage.
Isakeit, T. 2011. Sampling for Aflatoxin. Texas A&M AgriLIFE Extension bulletin.
Jones, R.K., Duncan, H.E., Payne, G.A., Leonard, K.J. 1980. Factors influencing infection by Aspergillus flavus in silk-inoculated corn. Plant Dis. 64:859-863.
Click on the video above to view Gibberella Ear Rot
![]()
Estimating Soybean Yield Potential – (Shaun N. Casteel) -
Soybean yield potential is built on numerous factors including the genetics that have been selected, the management decisions during the season, and the weather. Yield components of soybeans are boiled down to pods, seed size, and number of seeds per pod. In 2012, we had limited pod production due to the drought, but many fields made up a lot of ground with larger seeds due to late season rains.
Once again, the weather is driving the train for soybeans in 2013. The cool and cloudy conditions we experienced in July limited node development as well as pod development. The first weeks of August were also limiting the pod potential due to cooler weather. Some areas were already dry at this point, so the cool weather helped to prevent more pod loss. Dry conditions and excessive heat have caused our soybeans to decline. If you happened to catch some rain in the past couple of weeks, soybeans likely retained many of their pods even with the high temperatures. Pod loss has occurred in many fields in the past couple weeks and seed size was limited. Reductions in excessive heat and return of rain will help our soybean yield potential in terms of seed size more so than pod retention assuming the soybeans are into R6 (full seed) and beginning to drop leaves. At this point and time, most of the soybeans I have seen will be of average size (~3000 seeds per pound) to slightly small (~3200 seeds per pound). If your soybeans are just coming into R6, the yield potential still rests on pod retention and seed size.
When Should I Take Yield Estimates?
You need to use these factors and the understanding of your field conditions to estimate soybean yield potential prior to harvest. Soybean yield estimates can begin as soybeans enter into R5 (first seed, Figure 1). At this point, a fair portion of the pods have developed and seeds are filling throughout the whole plant. The yield potential at this point can be low or it can be high depending on the remaining 4 to 6 weeks of the growing season. Yield estimates will improve as the plants continue developing over the following ~15 days and enter R6 (full seed, Figure 2), which last another ~20 days.
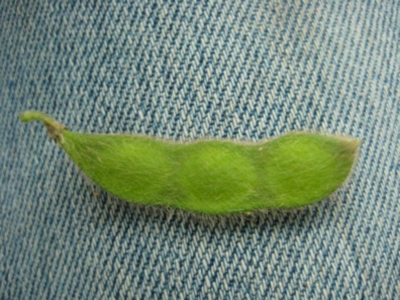
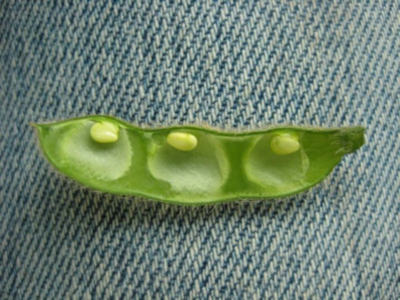
Figure 1. Soybean at R5 (first seed). Seeds are 1/8 inch long in one of the pods at the top 4 nodes.
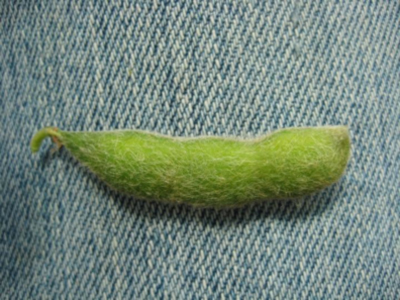
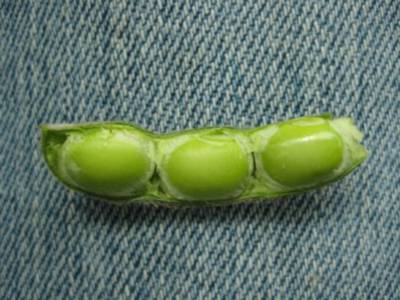
Figure 2. Soybean at R6 (first seed). Seeds filling the pod capacity in one pod at top 4 nodes.
Simplified Soybean Yield Estimation
Individual plant production will vary and we must take a representative sample without being extraneous. Every field will have variations based on soils, pests, fertility, and other factors. I have simplified the process of estimating soybean yields, so that you can scout multiple areas quickly while maintaining representative estimates.
The system is based on 1/10,000th acre and the following formula:
Pods X Seeds Per Pod ÷ Seed Size Factor = Estimated Bushels Per Acre
Step 1 – Pods
Count the number of pods in 1/10,000th of acre. Yes, 1/10,000th of acre! Nearly 90% of our Indiana soybean acres are planted in 30-, 15-, or 7.5-in rows, so just remember 21. You will count the number of pods in 1 row for 30-in width, 2 rows for 15-in width, or 4 rows for 7.5-in width to equal 1/10,000th acre (Figure 3). Each one of these counts will be 21 inches in length.
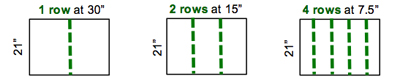
Figure 3. Number of rows to count to equal 1/10,000th of an acre.
We certainly have other row widths, and this simplified system can be adapted to your row width. If you have a different row width, divide 627.26 by your row width (inches) to calculate the linear length (inches) of 1 row to equal 1/10,000th acre. For example, an 18-in row width would require 34.8 inches of 1 row to equal 1/10,000th acre (627.26 18 inches).
This simplified system is more reliable when you have 8 or more plants in the sampled area, which translates to 80,000 plants per acre. If plant stands are less than 8, you should count additional areas to decrease the variability of the overall yield estimate for the field. If you want to have an idea of final plant stand, multiply the number of plants sampled by 10,000. However, you do not need plant population to estimate yield with this approach.
You will count the total number of pods in the 1/10,000th acre. You will need to use discretion to which pods you will include in the count. A good rule of thumb is to count the pods that are R5 or larger, with the knowledge that some of the smaller pods may or may not make it.
Step 2 – Seeds Per Pod
The starting point is an average of 2.5 seeds per pod, since there can be a range of 1-, 2-, 3-, and 4-seeded pods. This value is conservative since we do not know exactly how the rest of the season will finish. The soybean plants may arrest seed development on several 3-seeded pods or some pods are aborted completely. You can quickly increase or decrease the yield estimate by changing this one value. You can more confidently adjust this value because you are more likely to remember the frequency of 2- or 4-seeded pods within a few hundred pods.
Step 3 – Seed Size Factor
The starting point is seed size factor 18, which equals a fairly representative seed size of 3,000 seeds per pound. If you expect larger seeds (maybe from late season rains) you will use a smaller seed size factor such as 15 (2,500 seeds per pound). Similarly if seed fill will be limited (i.e., small seeds) due to lack of water or other late season stresses, you should use a larger seed size factor like 21 (3,500 seeds per pound). You should be using seed size factors of 18 to 21 with most fields in 2013 season.
| Table 1. Seed Size Factors | |
| Seeds Per Pound | Seed Size Factor |
| 2500 (large seed) | 15 |
| 2666 | 16 |
| 2833 | 17 |
| 3000 (normal seed) | 18 |
| 3166 | 19 |
| 3333 | 20 |
| 3500 (small seed) | 21 |
Pods X Seeds Per Pod ÷ Seed Size Factor = Estimated Bushels Per Acre
Examples:
Good soybean growth, good pod retention, and adequate late season moisture.
400 Pods X 2.5 Seeds Per Pod ÷ 18 = 55.5 bu/acre
Good early soybean growth, fair pod retention, BUT little late season moisture.
300 Pods X 2.5 Seeds Per Pod ÷ 21 = 35.7 bu/acre
Fair soybean growth, limited pod retention, BUT good late season moisture.
250 Pods X 2.5 Seeds Per Pod ÷ 15 = 41.7 bu/acre
Click on the video below to see: Estimating Soybean Yields - Simplified.
![]()
Corn Yield, Frosting, & Cake – (Bob Nielsen) -
Plain and simple................. the “frosting is off the cake” for many corn fields around Indiana as dry (and often excessively hot) conditions continue through the end of this 2013 grain filling period. In fact, for some fields, the “cake” is disappearing too.
Monday’s USDA crop progress report estimated that 67% of Indiana’s corn crop is at the dent stage of kernel development or beyond, which means that approximately 1/3 of the state’s crop is still in the dough stage of development with 50% of its yield potential yet to be determined. Once corn reaches the dent stage, so-called “experts” are often heard confidently stating that there is no reason to worry about further crop stresses because “the crop is made”. Actually, by the time a crop reaches full dent (every kernel dented), only about 60% of the crop has been “made” and there is still 40% of the potential yield “on the table” yet to be determined. Even by the time a crop has reached the so-called “half milkline” stage of kernel development (only about 2 weeks away from physiological maturity), sudden and complete death of the whole plant can result in yield losses as high as 12%.
Recognize that a crop of corn is not “made” until it has successfully reached physiological maturity. That is the final stage of kernel development determined by the presence of the thin, black layer at the tips of the kernels that prevents further movement of photosynthate into the grain.
NOTE: There is a common misconception that kernel black layer fails to develop in crops killed by drought, killing fall freezes, or other severe stresses. This is simply not true. Kernel black layer will always develop in corn grain. In fact, kernel black layer will develop sooner than expected on a calendar basis in severely stressed crops. When we talk about crops “shutting down” in response to severe stress, that means that the photosynthetic “machinery” is failing and the whole grain filling process is slowly coming to a grinding halt. Prove this to yourself by inspecting ears from droughty areas of a field with those from well-watered areas and you will see that kernel black layer develops sooner in the droughty areas. The same holds true for other severe stresses, such as extreme nitrogen deficiency.
The effects of inadequate rainfall throughout much of the grain filling period in Indiana (and elsewhere) have, at times, been amplified by the effects of excessively warm temperatures. Crops growing in soils with naturally low water-holding capacities or soils with significant levels of root-restricting soil compaction were the first to show the symptoms of drought stress (leaf rolling, lower leaf death, whole plant death). However, even crops growing in “good dirt” have been affected by the persistent lack of timely or adequate rainfall, coupled with excessive heat, in recent days and weeks.
Certainly, not every field of corn is in “dire straits” at the moment. Certainly, there will be fields of corn that yield well or possibly better than they ever have in the past. Just as certainly, there will be fields with significant yield losses due to excessively dry soils and excessively hot temperatures during the past 30 days or so.
It is imperative that growers recognize that such severe photosynthetic stress during the grain filling period often results in plants “cannibalizing” themselves to meet the carbohydrate “demands” of the developing grain. This is especially true when pollination and initial kernel set have been good; resulting in ears with high kernel numbers. Stored carbohydrate reserves in the lower stalk and leaf tissues are often remobilized to the developing ears in response to photosynthetic stress. Two consequences of such carbohydrate remobilization are the 1) physical weakening of the lower stalk and 2) increased susceptibility to root and stalk rots.
Such cannibalized or diseased plants are naturally more apt to break over or lodge in response to strong winds, potentially turning grain harvest into a frustrating and challenging operation. Growers ought to be walking drought-stressed fields during the next several weeks to assess the presence and severity of weakened stalks (or actual stalk breakage); then work towards prioritizing the weakest fields for early harvest to minimize the risk of significant mechanical harvest yield losses.
Related Reading
Nielsen, RL (Bob). 2013. Grain Fill Stages in Corn. Corny News Network, Purdue Extension. [online] <http://www.kingcorn.org/news/timeless/GrainFill.html> [URL accessed Sep 2013].
Nielsen, RL (Bob). 2013. Stress During Grain Fill: A Harbinger of Stalk Health Problems. Corny News Network, Purdue Extension. [online] <http://www.kingcorn.org/news/timeless/StalkHealth.html> [URL accessed Sep 2013].
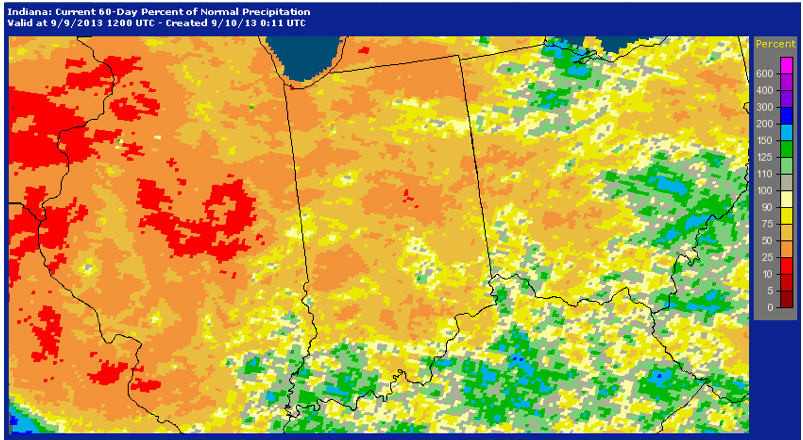
Figure 1. Percent of normal precipitation as of 9 Sept. 2013 for the previous 60 days. (Image Source: NWS-APHIS).
![]()
Field Drydown of Mature Corn Grain – (Bob Nielsen) -
Weather conditions strongly influence in-field grain drydown.
Plant characteristics can also influence in-field grain drydown.
Early grain maturation usually means faster in-field grain drydown.
Later grain maturation usually means slower in-field grain drydown.
Delayed maturity of corn due to late planting or simply cool growing seasons often translates into delayed or slow drydown of mature corn grain prior to harvest and, consequently, higher than desired grain moisture contents at harvest. Wetter grain at harvest increases the need for artificially drying the grain after harvest which, in turn, increases the growers’ production costs and can delay the progress of harvest itself. Conversely, an early or rapid drydown of the crop decreases growers’ costs and facilitates early or at least timely harvest of the crop prior to the colder and, often, wetter conditions of late fall.
Kernel moisture content decreases as the kernels develop through the blister stage (~ 85% moisture), milk stage (~ 80% moisture), dough stage (~ 70% moisture), dent stage (~ 55% moisture), and finally physiological maturity (~ 30% moisture). Prior to physiological maturity, decreases in kernel moisture occur from a combination of actual water loss (evaporation) from the kernel plus the continued accumulation of kernel dry matter via the grain filling process. After physiological maturity (identified by presence of the kernel black layer), percent kernel moisture continues to decrease primarily due to water loss from the kernel.
Weather & Timing of Grain Maturation
Grain moisture loss in the field occurs at a fairly linear rate within a range of grain moisture content from about 40 percent down to 15 to 20 percent, and then tapers off to little or no additional moisture loss after that. The exact rate of field drying varies among hybrids and years. Figure 1 illustrates changes in grain moisture content over time for an adapted medium maturity hybrid in two years with different temperature patterns following physiological maturity.
Field drying of mature corn grain is influenced primarily by weather factors, especially temperature and humidity/rainfall. Simply put, warmer temperatures and lower humidity encourage rapid field drying of corn grain. Figure 2 illustrates the relationship between the average daily temperature over the entire drydown period and the average daily rate of field drying over the entire drydown period.
Because grain drydown rates are greater when the drydown period is warmer, it stands to reason that a corn crop that matures in late August will dry down faster than one that matures in mid-September. In fact, there is a close relationship between the date when the grain nears physiological maturity (half-milkline or 2 to 3 weeks prior to kernel blacklayer) and the subsequent average daily drydown rate. Average daily drydown rates will range from about 0.8 percentage point per day for grain that nears maturity in late August to about 0.4 percentage point per day for grain that nears maturity in mid- to late September (Fig 3).
Bear in mind that grain moisture loss for any particular day may be quite high or low depending on the exact temperature, humidity, sunshine, or rain conditions that day. It is not unheard of for grain moisture to decline more than one percentage point per day for a period of days when conditions are warm, sunny, windy and dry. In contrast, there may be zero drydown of grain on cool, cloudy, rainy days.
Weather-Related Crop Stress and Field Drydown of Grain
Farmers often question whether field drydown will occur “normally” after some severe weather-related stress damages the crop prior to physiological maturity or causes premature death of the plants. Examples of such weather stress include damage caused by severe drought plus heat, late-season hail storms, and frost or killing freeze events prior to physiological maturity.
The answer in all cases to whether grain drydown will occur “normally” is essentially “yes”, but this requires a bit of explanation.
Lingering severe stress such as drought or foliar disease (e.g., gray leaf spot) that occurs during the latter stages of the grain filling period typically causes premature death of the plants, smaller than normal kernels, AND premature formation of kernel black layer. The latter two factors usually result in earlier than expected drydown of the grain to the extent that grain moisture content in severely affected areas of a field is usually drier at harvest than lesser affected areas. The fact that grain drydown of the “prematurely mature” grain begins earlier usually means it occurs in relatively warmer time periods and so grain drydown rates per day are higher than would be expected if the grain had matured “normally” at a later date. However, the rate of grain drydown is “normal” for the time period during which the grain is drying.
NOTE: When areas of fields die prematurely due to stresses like drought, spatial variability for grain moisture at harvest can be dramatic and often creates challenges with the management of the grain dryer operation. This is especially true early in the harvest season when grain moistures of healthier areas of the field are in the low 20’s. The spatial variability for grain moisture decreases later in the harvest season as grain moistures throughout the field settle to an equilibrium level (15% or less).
The effects of a sudden single stress event like hail or lethal cold temperatures prior to physiological maturity often create an optical illusion of sorts relative to subsequent field drying of the grain. Because leaf or plant death of an immature crop may occur quite rapidly in response to severe hail damage or lethal frost / freeze events, the moisture content of the yet immature grain will “appear” to be quite high given that the appearance of the now dead plants would seem to suggest the crop was “mature”. In fact, subsequent field drydown of the affected grain will occur fairly normally relative to their immature stage of development (Hicks, 2004). The appearance of the dead plant tissue gives the illusion that field drydown was slowed by the damage from the hail or frost/freeze.
Corny Trivia: Grain in fields severely damaged or killed by severe stresses during the grain filling period will always reach physiological maturity (kernel black layer). The significant reduction or complete cessation of photosynthate availability due to damaged or dead plants will eventually lead to the death and collapse of the placental tissue at the tips of kernels that then develops into the so-called “black layer.”
Hybrid Variability for Field Drydown
Hybrid variability for the rate of grain moisture loss during post-maturity drydown and the eventual grain moisture content at harvest are of great interest to grower and seed industry alike. Growers desire hybrids with superior yielding ability (maximum gross income) that also dry very quickly in the fall (minimum drying or grain shrinkage costs).
The seed industry uses grain moisture content data to assign relative hybrid maturity ratings on the basis of relative moisture differences among hybrids at harvest (Nielsen, 2012). Two hybrids that differ by one “day” of relative maturity will typically vary by about one half percentage point of grain moisture content (an average daily loss of moisture) if planted and harvested on the same days. Recognize that relative hybrid maturity ratings are most consistent within, not among, seed companies.
When weather conditions are great for rapid grain drydown, hybrids tend to dry at fairly similar rates. When weather conditions are not favorable for rapid drydown, then hybrid characteristics that influence the rate of grain drying become more important.
Researchers have identified the following traits or characteristics as ones most likely to influence grain drying in the field. The relative importance of each trait varies throughout the duration of the field drydown process and, as mentioned earlier, is most influential when weather conditions are not conducive for rapid grain drying.
• Kernel Pericarp Characteristics. The pericarp is the outermost layer of a corn kernel (botanically; the ovary wall). Thinner or simply more permeable pericarp layers have been associated with faster drying rates in the field.
• Husk Leaf Number. The fewer the number of husk leaves, the more rapid the grain moisture loss. In fact, modern hybrids have fewer husk leaves than those commonly grown years ago.
• Husk Leaf Thickness. The thinner the husk leaves, the more rapid the grain moisture loss.
• Husk Leaf Senescence. The sooner the husk leaves senesce (die), the more rapid the grain moisture loss.
• Husk Coverage of the Ear. The less the husk covers the tip of the ear, the more rapid the grain moisture loss.
• Husk Tightness. The looser the husk covers the ear, the more rapid the grain moisture loss.
• Ear Declination. The sooner the ears drop from an upright position after grain maturation to a downward position, the more rapid the grain moisture loss. In particular, husks of upright ears can “capture” rainfall.
Final Trivia For Coffeeshop Conversations
Interestingly, there is little, if any, documented evidence that moisture loss occurs through the pedicel (kernel connection to the cob) of the kernel through the cob tissue. Post-maturity grain moisture loss occurs primarily by evaporative loss from the kernel itself. Research many years ago established that post-maturity moisture loss through the kernel connective tissues (placental tissues) back to the cob is essentially non-existent (Kiesselbach and Walker, 1952; Crane et al., 1959). As those tissues cease to function (associated with the onset of kernel black layer and physiological maturity), the moisture and nutritional connection between kernel and cob is essentially broken.
Related References
Cavalieri, A.J. and O.S. Smith. 1985. Grain Filling and Field Drying of a Set of Maize Hybrids Released From 1930 to 1982. Crop Sci. 25:856-860.
Coulter, Jeff. 2008. Maturity, frost, and harvest moisture considerations for corn. Minnesota Crop News, Univ of Minnesota Extension. Online at <http://blog.lib.umn.edu/efans/cropnews/2008/09/maturity-frost-and-harvest-moi.html>. [URL accessed Sep 2013].
Crane, P.L., S.R. Miles, and J.E. Newman. 1959. Factors Associated With Varietal Differences in Rate of Field Drying in Corn. Agron. J. 51:318-320.
Elmore, Roger and Lori Abendroth. 2010. In-Field Drydown Rates and Harvest. Iowa Integrated Crop Management News, Iowa State Univ. Online at <http://www.extension.iastate.edu/CropNews/2010/0928elmoreabendroth.htm>. [URL accessed Sep 2013].
Hicks, D.R. 2004. The Corn Crop – Frost and Maturity. Minnesota Crop News, Univ of Minnesota Extension. Online at <http://blog.lib.umn.edu/efans/cropnews/2004/09/the-corn-crop---frost-and-matu.html> [URL accessed Sep 2013].
Hicks, D.R. and H.A. Cloud. 1991. Calculating Grain Weight Shrinkage in Corn Due to Mechanical Drying. Purdue Extension Publication NCH-61 Online at <http://www.ces.purdue.edu/extmedia/nch/nch-61.html> [URL accessed Sep 2013].
Kiesselbach, T. A. and Elda R. Walker. 1952. Structure of Certain Specialized Tissue in the Kernel of Corn. Am J Bot 39:561-69
Nielsen, R.L. (Bob). 2012. Interpreting Corn Hybrid Maturity Ratings. Corny News Network, Purdue Univ. Online at <http://www.kingcorn.org/news/timeless/HybridMaturity.html> [URL accessed Sep 2013].
Nielsen, R.L. (Bob). 2013. Grain Fill Stages in Corn. Corny News Network, Purdue Univ. Online at <http://www.kingcorn.org/news/timeless/GrainFill.html> [URL accessed Sep 2013].
Troyer, A.F. and W.B. Ambrose. 1971. Plant Characteristics Affecting Field Drying Rate of Ear Corn. Crop Sci. 11:529-531.
![]()
![]()